Calibrating the Wavelength of Your Spectrometer
This technical note will describe how to calibrate the wavelength of your spectrometer.
Each spectrometer is calibrated before it leaves Ocean Optics, but like all spectrometers,
the wavelength will drift slightly due to time and environmental conditions. To
recalibrate your spectrometer, just follow these simple steps:
What you are doing:
The relationship between pixel number and wavelength is a second-order polynomial ...

... where l is the wavelength of pixel p, I is the wavelength of pixel 0,
C1 is the first coefficient
(nm/pixel) and C2 is the second
coefficient (nm/pixel2). You will be calculating the value for I
and the two Cs.
What you will need:
- A light source that produces spectral lines. Ocean Optics offers a portable
Mercury-Argon lamp that is ideal for this purpose. Please contact us and ask about part
number HG-1. If you do not have an HG-1, you will need a spectral line source that
produces several (at least 3-5) spectral lines in the wavelength region of your
spectrometer.
- Your spectrometer.
- An optical fiber -- for spectrometers without a built in slit, a 50 micron fiber works
best.
- Either a spreadsheet program (Excel or Quattro Pro, for example) or a calculator that
performs second-order linear regressions. If you are using Microsoft Excel, make sure that
you have installed the Add-In called "Analysis Tool-Pack."
What you will need to do:
- After placing OOIBase into Scope Mode, take a spectrum of your light source. Adjust A/D
conversion frequency or integration time until there are several peaks on the screen that
are not off-scale.
- Move the cursor to one of the peaks and carefully position it so that it is at the point
of maximum intensity. Record the pixel number that is displayed in the status bar. Repeat
this step for all of the peaks in your spectrum.
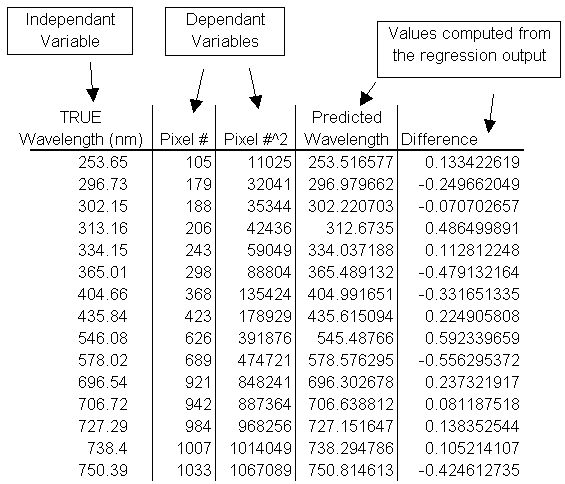
- Using your spreadsheet, create a table like the one shown below. In the first column,
place the exact wavelength of the spectral lines that you used. Most calibration line
sources come with a wavelength calibration sheet. If you do not have a wavelength
calibration sheet, you can probably find the wavelengths for your spectral lines (assuming
that they are being produced by pure elements) in the CRC Handbook of Chemistry and
Physics. In the second column of this worksheet, place the observed pixel number. In
the third column, place the pixel number squared.

- Now you are ready to calculate the wavelength calibration coefficients. In your
spreadsheet program, find the functions to perform linear regressions (in Quattro Pro,
look under Tools|Advanced Math, in Excel, it is in the Analysis Toolpack). Select the true
wavelength as the dependent variable (Y). Select BOTH the pixel number and pixel number
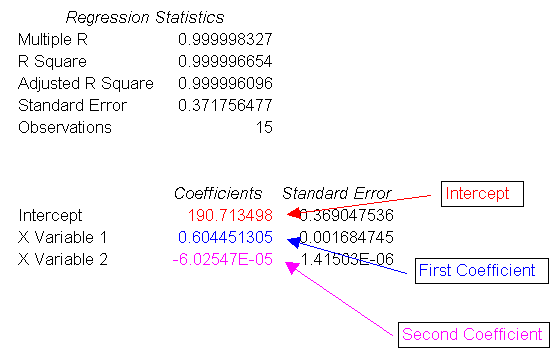
squared as the independent variables (X). After you execute the regression, an output
similar to the one shown below is obtained.

- The numbers of importance are indicated in the above figure. You will need to record the
Intercept as well as the First and Second Coefficients. Also, look at the value for R
squared. It should be VERY close to 1. If it is not, you have probably assigned one of
your wavelengths incorrectly.
- Select the menu option Setup|Configure Spectrometer to update the wavelength
coefficients within OOIBase.
- Repeat this process for each channel in your spectrometer.
For more information, visit the Ocean Optics web site at: www.oceanoptics.com
|
![]()